LiDAR
Guessing the bottom of a lake nobody has measured
Most ponds and lakes have never had their depth measured. The shoreline is easy, because a satellite photo shows it. The land around it is easy too, because the USGS has flown LiDAR over most of the country and publishes the bare ground at one-metre resolution. The bottom is the problem. LiDAR bounces off water, and for any lake of two acres or more the USGS deliberately flattens the water to one level surface. So the survey gives you a perfect flat lid and nothing under it.
I wanted PondTools to draw depth contours anyway, straight from that data, so a farm pond or a small lake could get a starting basin without a boat or sonar. This is how that went, including the part where I didn't believe the first version.
The first version looked fake
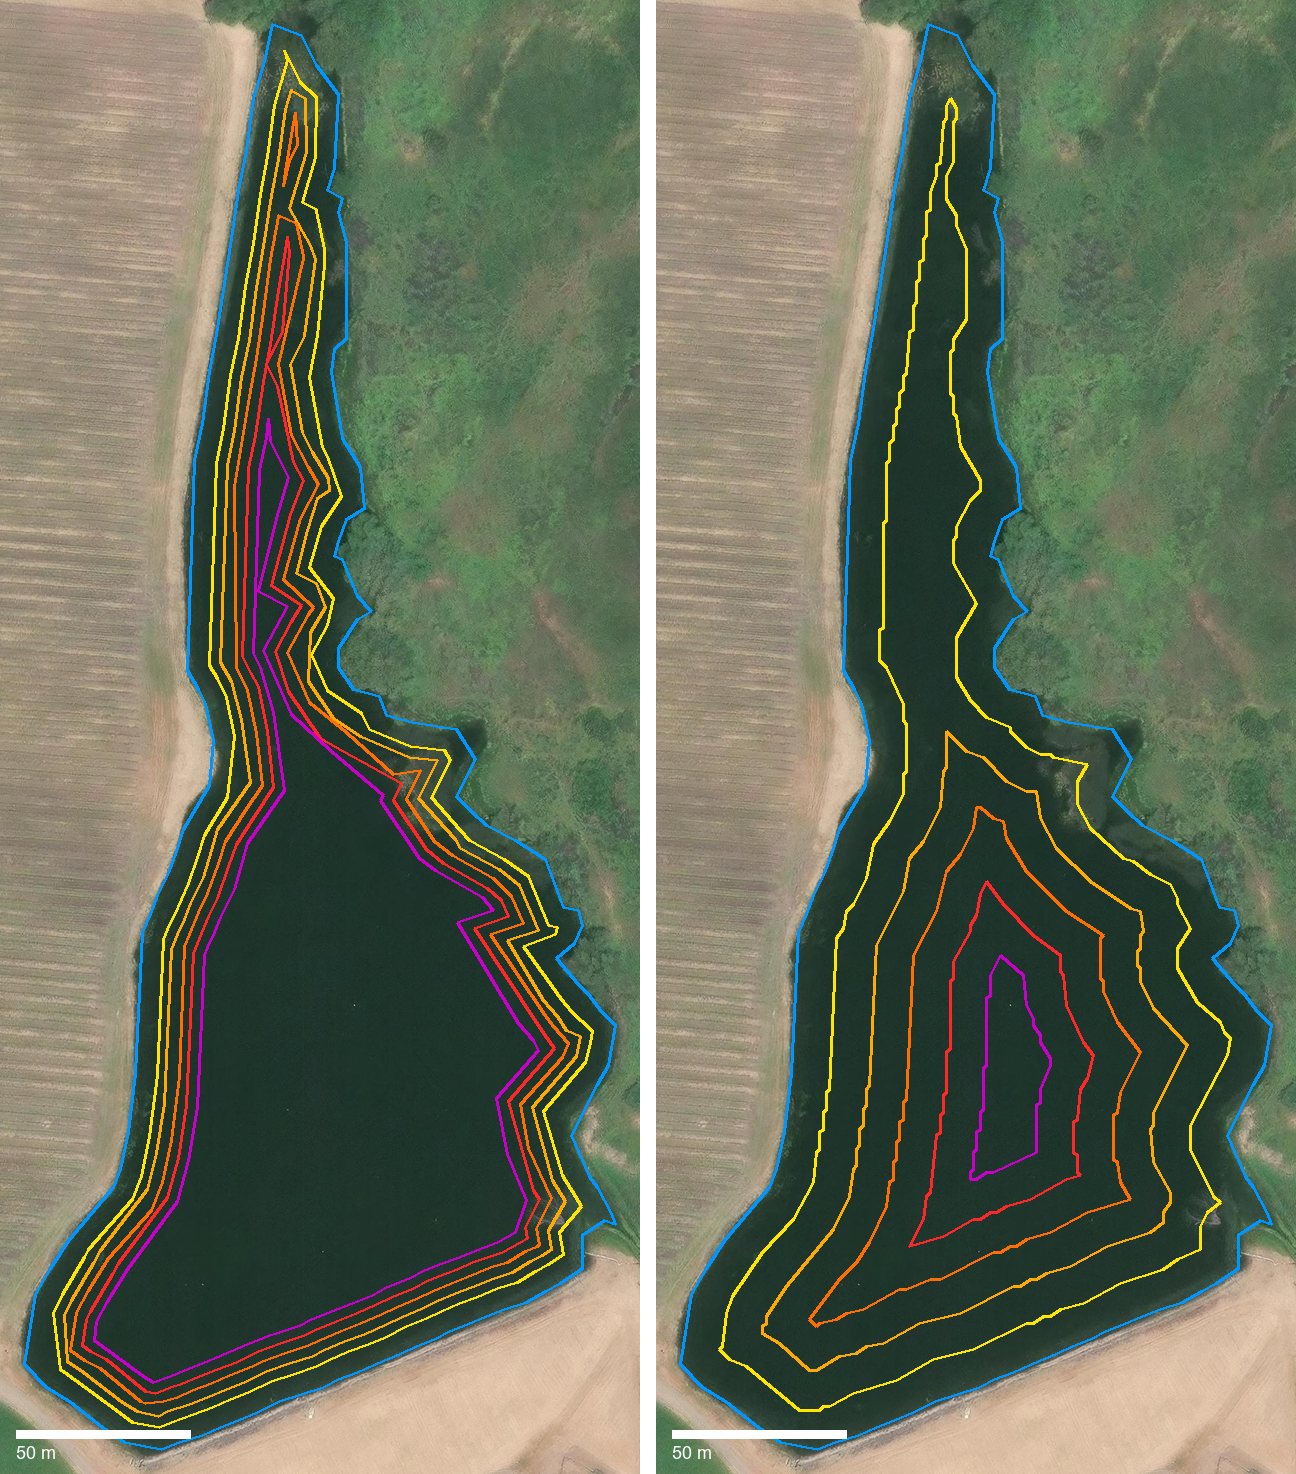
The first build found the flat water in the LiDAR, looked at how steep the banks were, and let the bed drop away from the shore at roughly that slope before levelling off. I tested it on a farm reservoir in Northern California, about 420 metres long. It gave me five rings stacked tight against the shore, then a flat floor at 300 inches under almost the whole lake.
It looked wrong to me, so I asked for cross-sections. The first ones had the vertical scale stretched, which made everything look dramatic and told me nothing. I asked for true scale instead, one metre across equal to one metre down, with every LiDAR sample drawn as a dot for 150 feet past each shore. At true scale a lake 135 metres wide and 9 metres deep is a thin sliver. That view is honest, and it's the only one I trust now.
Then it turned out the pictures I was looking at weren't what the product had actually drawn. Some came from a made-up test pond, and some from newer code than I had run. So I exported my project and had the exact contours in that file drawn over the photo, with nothing recomputed. Only then were we talking about the same thing. That also turned up a real bug. The photo water tracer was reshaping the LiDAR rings into evenly stepped copies of its own shoreline and keeping only their depth numbers.
The published method
There is a real, published way to do this. Jeffrey Hollister, Bryan Milstead and Andrea Urrutia at the EPA described it in 2011 in Predicting Maximum Lake Depth from Surrounding Topography, and Hollister's R package lakemorpho implements it. The idea is that a lake bed usually carries on the shape of the land around it.
It works in two steps. First, take the median slope of the land in a band around the lake. The band is as wide as the farthest any point in the lake gets from shore, or 100 metres, whichever is more. Multiply that slope by the same farthest distance, and you have the maximum depth. Second, make every point's depth proportional to its distance from shore, so the deepest spot is the one farthest from any bank.
On my reservoir the farthest point is 65 metres from shore, and the median slope around the lake is about 8 degrees. That works out to 351 inches, close to where my first version had landed. The shape was the difference. The published method gives a cone, with evenly spaced rings all the way in and a single deepest spot in the middle of the wide southern bowl. The narrow northern arm never gets deeper than five to ten feet, because nothing up there is far from a bank.

The paper is upfront about accuracy. Across about 28,000 lakes in the Northeast, its predictions of maximum depth had a typical error of 5 to 6 metres. So it's still an estimate, but it's one worked out from measured ground by a method other people have tested, which my first curve was not.
Two shorelines, both right
The cross-section showed something I first took for an error. On the east side the photo's waterline sits about 15 metres beyond where the LiDAR's flat water ends, and the survey shows the ground rising gently in between. The contours on the photo looked dead on to me, so the photo wasn't wrong.
Both are right. The LiDAR for this spot blends surveys flown between 2013 and 2024, and the satellite photo was taken on a different day. A farm reservoir rises and falls a few metres between seasons. If the survey was flown during a drawdown, that band is lake bed the LiDAR actually measured. It also means the water in the photo stood roughly two to three metres higher than the survey's water surface.
Why I picked the cone
Agricultural ponds really do have flat floors. They're dug or dammed, with steep sides and a level bottom, and the first version's shape is closer to how many of them are built. For that kind of pond I may end up preferring it.
I picked the published cone anyway, for a practical reason. Turning a cone into a flat-bottomed pond is easy: delete the inner rings that sit far apart and set the floor where you want it. Going the other way, building a believable cone out of a flat floor, means drawing every ring by hand. So the tool starts from the method that has a paper behind it, and you cut it down to fit your pond.
That's live now. In Measure a pond, capture a satellite photo with Import LiDAR ticked and trace the water. PondTools builds the bed inside your waterline with the published method, as round, evenly spaced rings you can edit or delete.
Sources
- Hollister, J. W., Milstead, W. B. and Urrutia, M. A. (2011). Predicting Maximum Lake Depth from Surrounding Topography. PLOS ONE 6(9): e25764.
- Hollister, J. and Stachelek, J. (2017). lakemorpho: Calculating lake morphometry metrics in R. F1000Research 6:1718.
- U.S. Geological Survey. Lidar Base Specification: Digital Elevation Model Surface Treatments, the hydro-flattening rules for lakes of two acres or more.